The brief
A payments operator opens this screen first thing and needs four answers before their coffee: what came in, what is owed out, what is stuck, and what is going wrong.
The work
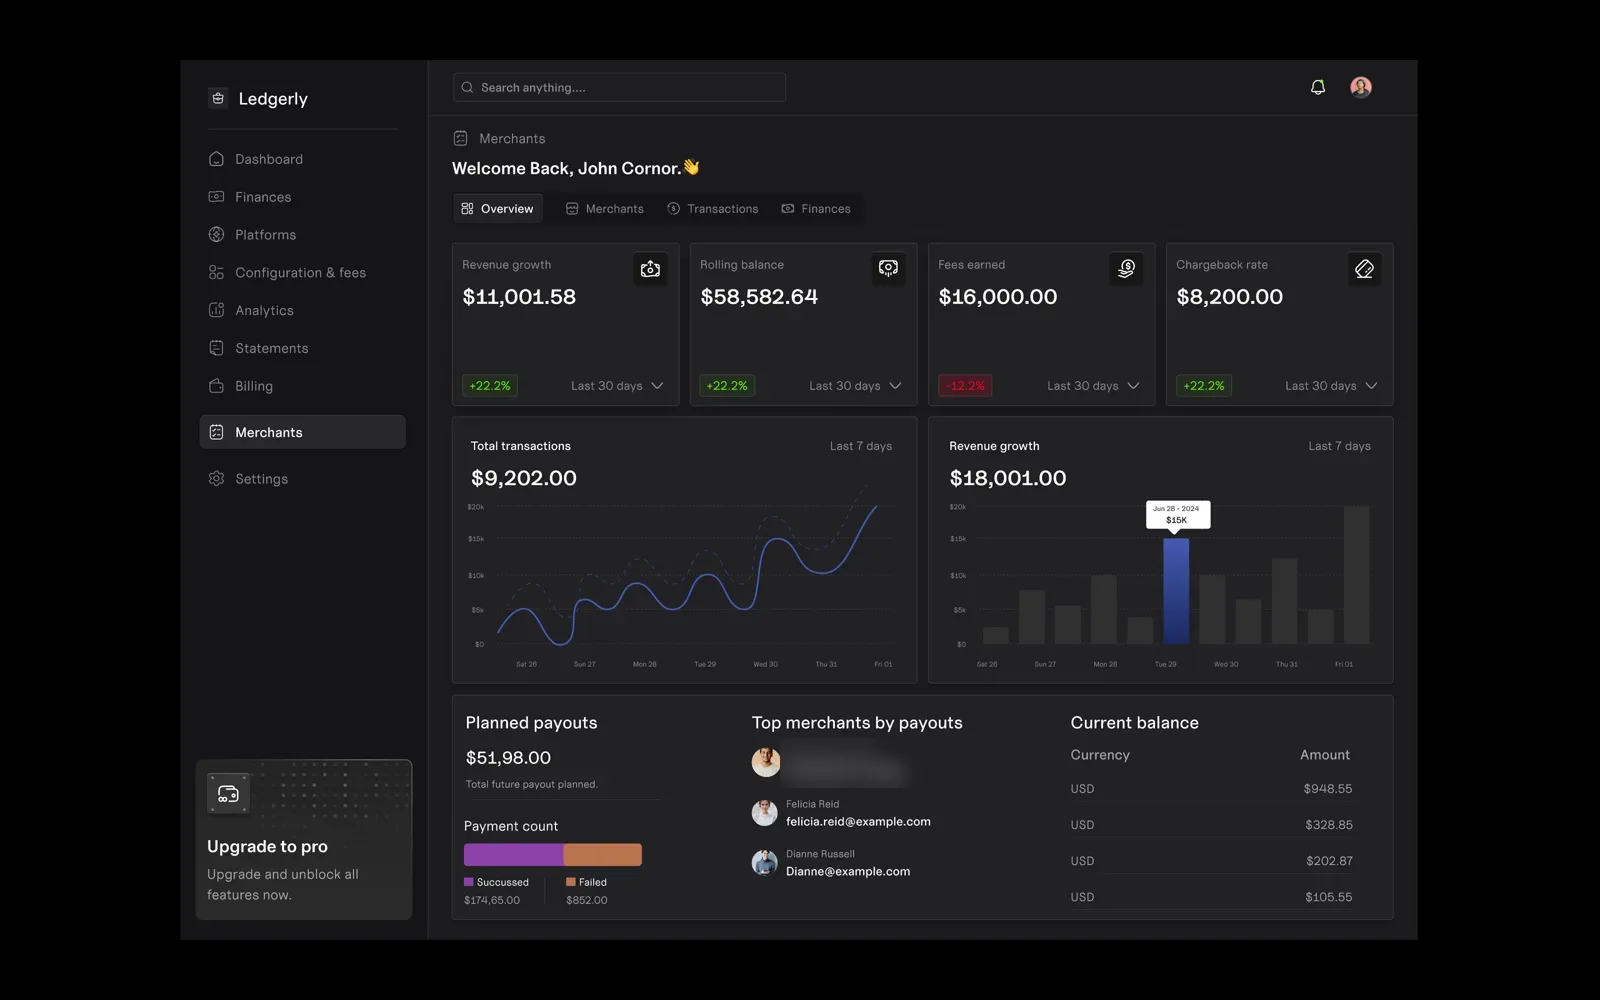
Those four became the top row and nothing else was allowed into it. Revenue growth, rolling balance, fees earned, chargeback rate — each with its movement, each readable from a step back. Everything below that row is for the second question, once the first has been answered.
The charts were designed to be compared rather than admired. Same axis treatment, same tick density, same height, so the eye can move between transactions and revenue without recalibrating. Two charts drawn to different scales side by side is a quiet way of lying.
Calls we made
Chargeback rate promoted into the top row. It is the number that ruins a quarter, and it usually gets buried.
Red and green used only for direction, never as decoration, so they keep their meaning.
Payout success and failure shown as one proportional bar — a ratio, not two numbers to subtract mentally.
Dark ground, because this screen sits open all day next to a terminal.